Posted by & filed under Articles, Fishing.

Jason Peters NC Artificial Reef  program coordinator, The NC Artificial Reef Program and the New AR Guide from an interview I did on the radio on 9/26/16

Today I’m talking to Jason Peters, Coordinator of North Carolina’s Artificial Reef Program.  Welcome Jason can you give us a brief history of NCs AR program, then we will talk about the new AR Reef Guide.

“So, I guess back in the 1940s and 1950s there was a lot of interest in fishing hard bottom but one of the major issues was the hard bottom habitat was so far offshore,” explained Peters,  “so grass roots effort began to put material a little bit closer to shore.” “It was fairly disorganized and there was no real standard of what types of materials to use.” “There were bath tubs, washing machines and things like that,” chuckled Peters, “and so and they worked for a couple of years they would rust away and be gone.”

“Then in the mid-1980s” said Peters, “the state took over from the individual permits that existed out there and set a standard on how we would build artificial reefs.” “One of the things that we do preserve is the idea that we want to improve access so we try to build reefs that people can get to that they can fish. Since the 1980s we’ve been chugging along we’ve been building lots of reefs we’ve got 62 now including the estuarine reefs and we try to enhance anywhere from two to four a year by sinking ships of putting concrete pipe and things like that.”

One of the reefs that has been enhanced recently was AR-330 when you sank the a ship renamed the James J. Francesconi in honor of Jim* the former coordinator of the AR Program.  So how did that sinking go Jason?


“Well it’s always stressful,” sighed Peters, “when you sink a ship; there are so many things that can go wrong.” “Even a potential for people to get hurt, but everything went off without a hitch, very-very well, sank right to the bottom, didn’t roll or anything. We actually sank two vessels, they are both upright right in line as we planned, clearance is about 17-feet so we meet all out permitting requirements and from what we hear there are tons of fish on them and the visibility is great.”


Now to the NEW Artificial Reef Guide. If you go to NCDMF website or stop in their offices in Morehead City, they have available their new AR Guide. I’m holding in my hands the original AR guide, done by Stephen Murphey back in 1995! It has nice hand drawn pictures of boats and rubble and concrete pipes and LORAN numbers which have to be translated into some other language for us to understand them right now. So Jason, the new reef guide which was paid for by our Coastal Recreational Fishing License (CRFL) fees by the way, can you give us an idea of what it looks like, how it’s organized, then we can get into the interactive reef guide on the NCDMF web site.

“I’ll start off by saying we’re really proud of this,” exclaimed Peters, “it’s been over 20-years since the last publication and there are a lot of people that put in a lot of time into this particularly Amy Comer-Flowers, and Rachel Love-Adrick, that really created this and edited it.” “What you will get when you pick this book up is…so it’s a spiral bound book and it’s got water-proof pages. Essentially we have every single artificial reef in North Carolina, so all 62 reefs. It’s broken down into sections by bays in the ocean. All the reefs in the Outer Banks is in one section, Raleigh Bay which is from Cape Hatteras to Cape Lookout, Onslow Bay, Long Bay and then our estuarine reefs.”

“And if you go to any particular reef,” said Peters, “you get a table and you get a map.” “So the map is outlined reef patches that are based off of side-scan sonar imagery that was collected in the last 5- or 6-years, and an identifier. And that identifier number will link you back to the table where you can read about the material type, when it was deployed, and get GPS coordinates for each one of those patches. On top of that for each reef, you get provided the magnetic direction and distance from nearby inlets. 

I noticed in the guide book that you can write in your own notes.

“Absolutely,” said Peters, “we got a little note section so that as your fishing it as you decide which patches you like best or what you’re catching or different conditions you can write down your notes and go back and hopefully recreate the scenario the next time you fish.”

Now on these reefs you have “patches” of stuff, how were those generated where you have clusters of the pipes or the ships or whatever?

Sure, so as I mentioned, each reef was side scanned or has been side scanned in the last 5- or 6- years,” said Peters, and “CRFL funds actually funded a staff member to outline each one of the patches in GIS (Geographic Information Systems) or a geographic mapping program, and that’s how we got those. What you see is actually what’s on the bottom.”

I noticed that it was really up-to-date since you even have the boats you recently sank this spring there at AR-330. You ran out there and touched up, did the final touchups before this got printed.

“Yes,” smiled Peters, “we wanted it to be the most up-to-date, the most accurate version that we could provide.”  “I think the plan is every few years, maybe 5- or 6-years we’ll try to come up with and update.”

Not 20-years!

“No not 20-years,” said Peters, “we’ll try to be a little quicker than that.”

Another really big advantage, if you go to the Marine Fisheries web site portal is that the new guide has a user friendly interactive web site, with simple to follow short tutorials. Can you explain how that is set up and how the sonar side-scan data is represented?

“We’re trying to keep up with the times,” explained Peters, “so we’ve gone digital with our reef guide.” “There’s an on-line version, an interactive version that you can find on our web site (http://portal.ncdenr.org/web/mf/artificial-reefs-program). Essentially you get all the information that you can get in the printed guide and then in addition to that there are some mapping tools that help you determine distances for example, and distances between patches. You can also create personalized maps of certain areas on reefs that you can print out.”

I noticed that you can create like a polygon or something around a particular area, mark that or print it out or preserve it.

“That’s exactly right,” said Peters, “ if there’s a certain portion of a reef you really like or you want to zoom in on you can zoom in on that and print it right out.”

It’s like a Google Maps, like going in and looking at neighborhoods.

“That’s a good description,” agreed Peters, “that’s actually the description that I use to explain it to people, it’s a lot like Google Maps where you can zoom in.”

I also noticed that when I was running a cursor over something you get the GPS locations of any one of those spots.

“That’s correct,” said Peters, “if you find a patch you like you can click on it and there will be a little pop-up window that will give you GPS information, material information and actually in some cases with the vessels there are links to the history of the vessel that was sunk there so it you are a history buff you can get a little background information on that vessel. Also with the zooming tool, you can see individual pipes and reef balls and things like that, it’s real neat.”

So Jason, what are the plans of the artificial reef program, what can we look forward in the future?

 “We’re very-very active”, spirited Peters, “we have a lot going on. “Particularly this year we’re planning on sinking two vessels at AR-320, that’s the Novelty ship site off Atlantic Beach, so hopefully if all goes well we’ll get that done sometime this late fall or winter or early part of 2017 depending on how the cleaning process goes with the vessels.” “We’re also looking at two brand new artificial reefs that will be estuarine artificial reefs in Carteret County in Bogue Sound. One potentially in Cedar Point and one in Atlantic Beach, so we’re in the very early stages of planning that out. We’ve got an enhancement project down at AR-430 down off Oak Island, that will be about 4,000 tons of concrete pipe and we’ve also got some work proposed at AR-372, that’s down off Wrightsville Beach, that’s again a concrete pipe project.”

Concrete, that’s a great reef material.

“It really is,” exclaimed Peters, “it provides great habitat, lots of nooks and crannies. And we’re also looking into a brand new artificial reef site in the ocean off the Outer Banks.”

Would that be from the Bonner Bridge material?

“Actually no,” corrected Peters, “ this would be completely new and pending a CRFL application that’s in right now and depending on whether or not that gets funded there might be a new reef up there.”

So what will be the status of the Bonner Bridge remains as they tear down the old bridge for the new span?

“For the Bonner Bridge material,” said Peters, “we’re looking at some time in 2018.” “Once the new bridge is constructed they will demolish the old one and we’ll and we’ll take that material and distribute among the four reefs on the Outer Banks.”

That will make a lot of material!

“Yes,” exclaimed Peters, “80,000 tons!”

“That beats tires,” I said!

“Don’t even speak those words around here,” shouted Peters.

Sorry Jason!

——————————————–

*Jim Francesconi who was the former coordinator of the AR Program for 14-years (2000-2014), passed away from a long bout with leukemia In July 2014. Jim was the heart and soul of the program during that time, and particularly loved AR 330.  The ship was renamed the James J. Francesconi and sunk in his honor. A plate acknowledging that is permanently affixed to the ship.


Posted by & filed under Articles, Fishing.

Surf at Bogue Pier ranged from high of 56-degrees to a low of 44-degrees with an average of 51.9-degrees (blue diamonds). Bogue Sound had a high of 57-degrees but a low of 32-degrees with an average of 49.8-degrees (red squares).  Temperatures in January were near or slightly above normal except for the dive they took January 7-10, 2017 and resulted in minor trout kills most notably in the North River. Slope was nearly flat showing a very slight but not significant rise.

Posted by & filed under Articles, Fishing.

NCDMF Carcass Collection Program by Dr. Bogus

So I went out fishing the other day, tried top-water bait for a red drum and landed a feisty slot 23-inch red, however I struck out using live finger mullet for flounder only catching a few undersized 12- or 13-inch throwbacks, and all the time I was thinking It would be nice if we had a good run of speckled trout along the surf this fall. We have all had successes and failures and we have all dodged the minefield that is the moving target of fisheries regulations. By the way, there’s an APP for that!

Effective fisheries management requires real fish-data to assess the viability of important commercial and recreational species.  Stock assessments to attain breed stock, mortality, age and population distributions act as data to be inputted into complex models to assess the health or not of various important commercial and recreational species as flounder, gray and speckled trout, red and black drum to name just a few. Data to be used come from many sources such as fish tagging studies, fishermen onsite fishing pier, marina, boat ramp and phone surveys, commercial trip tickets and now more recently the North Carolina Division of Marine Fisheries (NCDMF) has instituted a recreational carcass collection program. Yes, you now have something to do with your dead fish carcasses that don’t involve crab bait!

I recently talked with Randy Gregory on my radio show (WTKF 107.1 FM 1240 AM, every Monday morning at 7:30 AM) about this relatively new program. Randy is a fisheries biologist who has worked in NCDMF for over 27-years and currently runs their age and growth laboratory. You may have even seen him at various fishing tournaments around the state including the Governor’s Cup Billfish Conservation Series which includes the world renowned Big Rock Blue Marlin Tournament.

As Gregory points out, “We can’t go out and have a census for fish. We can’t go and ask how old they are how many fry they have in their house and those kinds of things, so what we do is build an idea of what the age structure of the population looks like and then through our catch and through our landings we try to figure out the numbers of each of those fish in those age groups.”

How does the carcass collection program do this? “First we’ve gone out and placed freezers at marinas and other places where recreational fishermen will congregate, tackle shops, things like that.” said Gregory,  so in the local area, here around Morehead, we have a place at Harker’s Island, we have Freeman’s Tackle over in Atlantic Beach, Dudley’s Marina down in Swansboro. So those are our collection centers and what we want people to do is bring us their recreational catch after they fillet it.”

After they filleted  their dinner out?  “Yes,” said Gregory, “we just need the rack, we just need the carcass! But we need the head but we need the whole length, so we need to figure out how long it is, what the sex of the fish is. We don’t need a whole lot of information for that so anybody that normally fillets their fish we can usually figure out most of them.”

So I’m a fisherman, I cleaned my fish, what do I do then? “We want you to fill out a catch card,” explained Gregory, “it gives us a little information about you and about where you caught your fish which is always something that we need. And we have freezer bags and you can put your filleted catch in the bag and you tie it up with a little red tie and throw it in the freezer and we come around when maybe somebody call us and says they have some stuff in the freezer.”

How about feedback? “If we get a good sample,” said Gregory, “we let them know. Fresh is always better, I want to stress that, we want it just like you were going to eat it, and you put it in the freezer, because when things deteriorate we have trouble.”

Now I know you can’t go out in the sea and ask a fish how old it is, but if you have his carcass how do you find out how old he is? You filleted him out and he’s still not talking! “That’s why we need the head,” explained Gregory, “in the head they have an ear stone and it’s called an otolith and they put down rings like rings on a tree, and that’s what we use to age the fish.”

Like yearly growth rings?  “Yes,” said Gregory, “and basically the otoliths sit in a sack, in the base of the brain and ride on some little hairs and they act as the fish’s ear bone and they also use it for balance. They are made of calcium carbonate and are every hard. Some of them are quite large, the fish in the drum family, the trout and the drum have very large otoliths, Spanish mackerel and bluefish are quite small.”

Then what, I asked? “Sometime we can look at them whole with some species, other species we have to cut them with a rock cutting saw. The bone is very hard and can be brittle but it’s hard and we use a diamond wheeled saw, just like you would cut rocks with or metal.”

So you cut through so you can look at the “tree” rings and count them? Yes,’ said Gregory, “usually under the microscope and sometimes it takes a little bit of work to get to that but usually it’s fairly straight forward.”

Gregory noted that in 2015, they had over 1000 fish deposited into the carcass collection program. With Freeman’s Bait and Tackle in Atlantic Beach leading the way.

With all these fish did you have any unexpected results? Any eureka moments? “Yah, actually a really cool one that I didn’t expect. A couple years ago the South Atlantic Fishery Management Council was managing sheepshead, and decided they weren’t going to do that anymore. So the sheepshead was kind of on a hot plate, like what are we going to do with this fish, should we enact some regulations and things like that, so I personally didn’t know a whole lot about sheepshead other than I really like to eat them and I like to catch them and they are hard to catch. So one of the things that we started doing, and we realized and getting sheepshead carcasses, getting the age structures out of the sheepshead was going to difficult, because not many are landed commercially, not many are landed openly recreationally because sheepshead fishermen are pretty secretive. So we added sheepshead to the carcass collection program…amazingly some of these big sheepshead can be quite old. It didn’t really know it before. I did my research and turns out we have some fish that are 30-years old, some 8-, 9-pound sheepshead. That’s a big sheepshead but not extremely rare, but a slow growing fish. They grow pretty quick up to a point, they get a couple of pounds and then they really kind of slow down, so that was the coolest thing it think that I saw what we are doing with these species.”

Do you do tournaments too like the Big Rock Blue Marlin Tournament? “Yes we do,” said Gregory, “we are at tournaments, we were at the Carolina Beach KMT, the East Coast Got ‘em on Classic this weekend, and then I was in Hatteras at a billfish tournament the Hatteras Grand Slam Tournament, so tournaments are another place that congregates recreational fishing and catches and allows us sometimes a good way to sample.”

People always ask what happens to the tournament fish, like from the Big Rock. “We would consider blue marlin a rare event species,” explained Gregory, “not very many are landed. Matter of fact there is a federal law that says only 250 blue and white marlin can be landed in the Atlantic by US fishermen, and we only land about 160-, 170-fish a year. So we take every opportunity that we can to get information off these fish.”

So when nine blue marlin were landed in the Big Rock Tournament this year (2016) that’s a pretty significant number then?  “It is,” agreed Gregory, “but what we do is to work with the North Carolina Governors Cup  program that the DMF has with the state’s big bill fish tournaments throughout the state and what we’ve done is along with the Big Rock BMT we’ve worked with North Carolina State University to bring researchers to get all the information that we can not only off the blue marlin that are landed but also the other game fish that were landed. So we had this year at the weigh station a whole group of veterinary technicians, we had biologists, there were probably a dozen people working on these fish when they came in. And then the billfish actually go back to the Center for Marine Sciences and Technology lab (CMAST), to the NC State Lab and there is all kinds of information they’re getting off those fish like their diet, tissue and a dozen different things that they are doing all at one time along with their age including the winning 600-pound blue marlin.

So how big is the otolith of a 600-pound marlin? “Well,” said Gregory, “only a couple of millimeters long, they are very difficult to age.”

So if you want to enter the realm of citizen scientist and help our understanding of the North Carolina’s important recreational fish species, it’s time to put your discarded fish carcasses to good use. Fillet it, bag it, freeze it and donate it to the NC Marine Fisheries Carcass Collection Program.

Species to be collected include (15): black sea bass, black drum, croaker, cobia, flounder, gray trout (weakfish),  grouper, red drum, sea mullet (kingfish), sheepshead, snapper, Spanish mackerel, spotted seatrout (speckled trout), striped bass and triggerfish.

Drop off Freezer Locations (13): Jennette’s Pier, Nags Head; Fishing Unlimited, Nags Head Causeway; Frank and Fran’s, Avon; East Side Bait and Tackle, Washington; Cape Pointe Marina, Harker’s Island; Freeman’s Bait and Tackle, Atlantic Beach; Dudley’s Marina, Cedar Point; The Tackle Box, Southport; Frisco Rod and Gun, Frisco; Red Drum Tackle, Buxton; East Coast Sports, Surf City.

For more information on the Carcass Collection Program, log onto: http://portal.ncdenr.org/web/mf/carcass-collection.

Posted by & filed under Articles, Fishing.


Internal Guidelines for Adaptive Management for Cold Stun Closures

Dec. 14, 2016

I. Issue

         Since 2011, the North Carolina Division of Marine Fisheries (NCDMF) has followed a set of guidelines to determine if closing the spotted seatrout commercial and recreational fisheries after severe winter cold stun events are warranted (NCDMF 2012). The decision to close the fishery is left to the discretion of the director after significant cold stun events have been reported in at least four North Carolina counties. There were reported cold stun events during the winter of 2014-2015, but it was determined a closure was not warranted. Afterwards, members of the public expressed concern with the current guidelines, citing a perceived subjectivity by the NCDMF staff and its director when classifying a cold stun as “significant.

II. Origination

         After the winter of 2014-2015, members of the public and the North Carolina Marine Fisheries Commission (MFC) expressed concern over the current cold stun closure guidelines and voiced a desire to change the current strategy. Subsequently, the director instructed NCDMF staff to investigate alternative options for spotted seatrout cold stun closures, including a more quantifiable metric to trigger action.

III. BACKGROUND

         Spotted seatrout (Cynoscion nebulosus) and other finfish that over-winter in estuarine environments in North Carolina are susceptible to periodic cold stun events. These events are caused when water temperatures fall below a fish’s metabolic thermal minimum, inducing loss of equilibrium and immobilization. If periods of sub optimal water temperatures persist and fish are unable to move to warmer waters, mortalities can occur. In North Carolina, coldstun events can be triggered by snow and ice melt following a winter storm or by prolonged below average air temperatures from periodic arctic cold fronts. The former is more characteristic of early winter cold stuns where water temperatures in creeks and bays can change rapidly from cold water runoff, and the latter is more typical later in the winter when water temperatures gradually fall below the optimal temperatures for the fish and induce cold stun from long-term exposure. Cold stun events can be localized to single river systems, and even individual tributaries; or they can be widespread across multiple estuaries or even statewide if conditions are right. Mortalities from cold stuns have been identified as a factor contributing to variable natural mortality in spotted seatrout (Ellis 2014; NCDMF 2009, 2015). It has been suggested that declines in spotted seatrout abundance may be due, in some part, to mass mortalities from severe cold stuns. Mass mortality events observed in North Carolina from cold stuns have been an historical occurrence and have occurred as recently as the winters of 2000, 2002, 2004, 2009, 2010, 2011 and 2015.


As a response to the results of the 2009 Spotted Seatrout Stock Assessment and public concern over the detrimental effects of frequent cold stuns on the spotted seatrout stock, the MFC, upon its approval of the Spotted Seatrout Fishery Management Plan (FMP), decided not to develop a protocol for cold stun closures. Rather, the MFC instructed the director to “Remain status quo with the assumption that the Director will intervene in the event of a catastrophic event and do what is necessary in terms of temporary closures by water body” (NCDMF 2012). Subsequently, the director instructed NCDMF staff to develop an adaptive management approach for determining when a closure was necessary and the duration of that closure. Lead staff and the Spotted Seatrout Plan Development Team (PDT) developed the current guidelines with input from the MFC (February 2012). Currently, for the director to issue a proclamation to close the spotted seatrout fishery, verifiable cold stunned fish must occur in at least four counties. If this condition is met, at the director’s discretion the fishery is closed until June 15 of the following spring. Keeping the fishery closed until late spring affords mature fish that survived the winter the opportunity to spawn at least once before the fishery reopens.


   Since the first FMP for spotted seatrout (NCDMF 2012) and the development of the cold stun closure guidelines, the director has issued proclamations closing the commercial and recreational spotted seatrout fisheries twice for meeting the conditions triggering action outlined in the guidelines (Proclamation FF-7-2011; FF-30-2011; FF-9-2014). During the winters of 2011 (December 2010 — January 2011) and 2014 (February 2014), cold stunned fish were observed in many coastal counties and air and water temperatures remained very low for days to weeks. During these events, members of the public expressed desire to have the fishery closed and NCDMF was confident that the cold stun was wide-spread and severe enough to warrant a closure under the cold stun closure guidelines.


          During the winter of 2015 (February 2015), cold stunned fish were observed in some of the southern Neuse River tributaries, Bay River, and southern Hyde County bays. Cold stunned fish were localized to small tributaries mostly on the southern portion of the river systems. Most reports of stunned fish from the public were unverified or inconsistent with what was observed by NCDMF staff in the field. For this event, NCDMF staff determined that the four-county threshold was not met and the director did not choose to close the fishery. This decision was unpopular with some members of the public. Their opinion was that the low landings from 2015 were a direct result of the cold stun that occurred earlier in the year and a closure may have saved more adults for the spring spawn. The public expressed frustration with the perceived subjectivity of a significant cold stun event and the decision to not close the fishery under the current closure guidelines. The director then asked lead staff to develop an adaptive management approach that was more objective and quantifiable.


IV.Discussion


         Until recently, empirical estimates of sublethal thermal minimums and lethal acclimated chronic exposure times were not available for spotted seatrout in their northern range. Anweiler et al. (2014) exposed hatchery reared age-0 fish to rapid declines in water temperature (1 °C [1.8 °F]/day) to determine the absolute lethal minimum and also chronic exposure to static and fluctuating sub lethal temperatures (5.25°C [41.5°F] and 4.25°C [39.7° F]) to evaluate prolonged lethal exposure. Fish lost equilibrium at an average critical thermal temperature of 3.57°C ± 0.24°C (38.4°F ± 0.43 °F) and suffered mortality at an average temperature of 3.08 °C ± 0.31°C (37.5 °F ± 0.56 °F). Survival was significantly different between the two static temperature treatments with the highest mortality occurring at 4.25°C (39.7°F). However, fluctuations around the temperatures did not have a significant effect on survival compared to the static treatments. Ellis et al. (2016; in review) took this experiment a step further and introduced the covariate of salinity as well as performing the experiments with larger age-0 and age-1 fish harvested from North Carolina estuaries. They observed that fish exposed to rapid changes in water temperature (1 °C [1.8 °F]/hour) lost equilibrium at temperatures ≤ 3.5°C (38.3°F), similar to the Anweiler et al. (2014) study. Mortality induced from long-term exposure was evaluated at three discrete temperatures (3°C [37.4°F], 5°C [41°F], and 7°C [44.6 °F]) and two salinities (10 and 30 PSU) for a 10-day period. Salinity did not have a significant effect on survival within each of the temperatures but survival across all the temperature treatments was different. All fish exposed to 3 °C (37.4 °F) water did not survive after two days with an estimated 50% probability of survival after one day. At 5 °C (41 °F), most fish survived up to five days before mortalities started to occur and by day eight estimated survival probabilities fell below 50%. Mortalities were low for fish exposed to 7 °C (44.6 °F) with survival probabilities of approximately 90% at the end of the 10-day period.


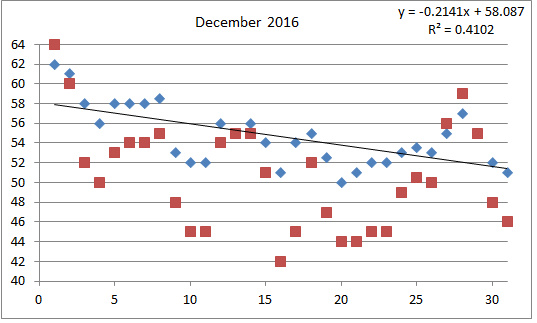
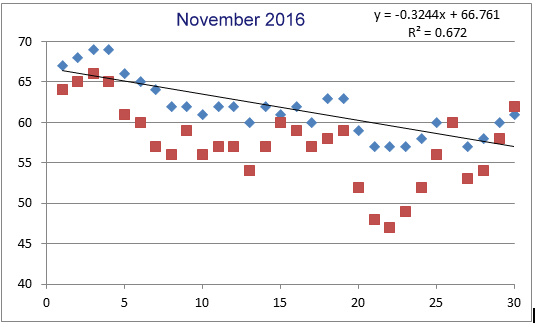
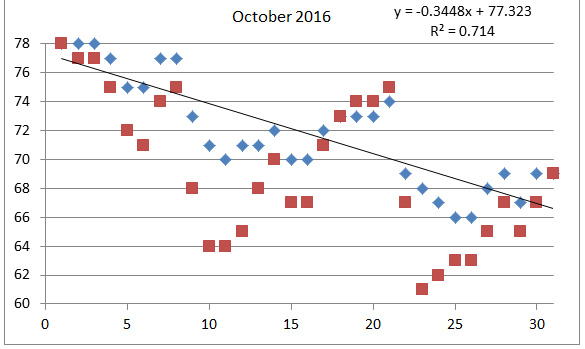
          Ellis et al. (2016; in review) then developed a temperature-based model for predicting the natural mortality (M) of spotted seatrout in the winter based off of the laboratory results and observed estimates of natural mortality from tagging data. Natural mortality based on the annual cumulative cold degree days of <7 °C and <5 °C was modeled for the winters of 1994 – 2015 using water temperature data collected from the National Estuarine Research Reserve at Zeke’s Island, North Carolina. The results were compared to observed estimates of M from previous tagging work (Ellis 2014) for the four years it was available (Figure 1). Cumulative degree days at <7 °C and <5 °C for the years modeled varied widely with some years never reaching the temperature thresholds, while others met or exceeded the eight-day exposure limit for 50% survival at 5 °C by almost twofold. In years where confirmed cold stun events occurred, the model predicted high M and CDD exceeded the eight-day threshold. Modeled estimates of M highly associated with observed estimates inferred from tagging data for both the <7 °C (P=0.003) and <5 °C (P=0.004) metrics. Overall, low temperature metrics (CTM and exposure) inferred for spotted seatrout from laboratory experiments are consistent with observed patterns of winter severity and mortality and may be useful for evaluating the impact of future cold stun events to the spotted seatrout stock.


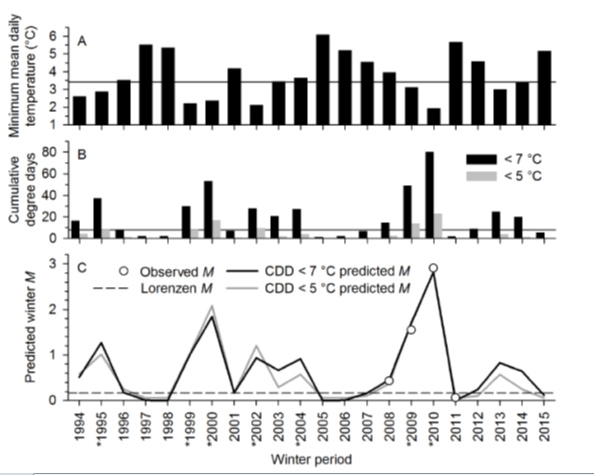
          Figure 1. Taken from Ellis et al. (2016; in review). Minimum winter (November – February) mean daily temperatures (A) and cumulative cold degree days (CDD) of temperatures < 7 °C (black) and < 5 °C (grey) occurring during the winter period (B). Horizontal line indicates the laboratory estimates of critical thermal minimum (3.57 °C ± 0.24°C) and 50% mortality at 5 °C over eight days for panels A and B, respectively. Rate of natural mortality (M) of spotted seatrout estimated for each winter using the predictive model developed with both temperature metrics (black and grey lines), observed natural mortality inferred from tagging data (open circles), and the Lorenzen weight-based estimate of winter natural mortality used during the previous spotted seatrout stock assessment (NCDMF 2012). Asterisks next to winter periods denotes years where cold stuns were have known to occur.


          In 2015, the NCDMF started a comprehensive, statewide water quality monitoring program (program 909) and deployed a statewide array of continuous water temperature loggers and data sondes. A total of 80 loggers at 55 stations measure water temperature every 15 minutes. Station locations are distributed throughout coastal North Carolina with specific locations that staff felt were representative of the riverine and estuarine systems they were in and locations of historical occurrences of cold stuns (Figure 2). At depths greater than 2 meters, two loggers were placed to monitor temperatures at the surface and bottom to help managers identify water column stratification and turnover events. In addition to the 80 temperature loggers, the NCDMF also deploys and maintains around 25 water quality data sondes that also collect water temperature data. These sondes are located mostly in Albemarle and Pamlico sounds and are used for monitoring water quality for alosine habitat and artificial reef conditions.


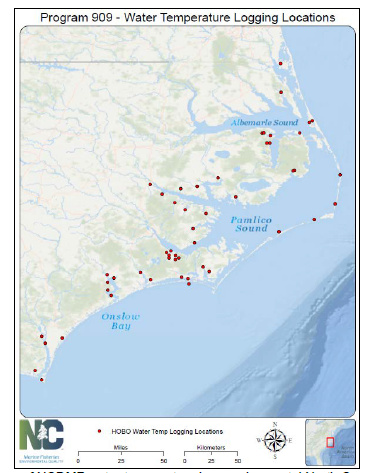
Figure 2. Locations of NCDMF water temperature loggers in coastal North Carolina.


          Given what is now known about spotted seatrout temperature tolerances and available water quality data from the NCDMF temperature loggers and data sondes, more quantitative information can be used in determining the necessity of a fishery closure. Better understanding of spotted seatrout physiology can allow for quantitative temperature triggers that incorporate estimated probabilities of survival to provide the director with a measurable metric to inform his decision on a spotted seatrout fishery closure. However, due to unequal distribution of spotted seatrout throughout its overwintering habitat, a closure should not be based on temperature alone. The reported presence of cold stunned fish should also be considered when making this decision.


          The spatial extent of cold stun events should be considered when evaluating the efficacy of a fishery closure. Historically, cold stun events have varied in their spatial coverage and have ranged from a few isolated creeks in one river system to multiple riverine and estuarine systems. Wind and tidal influences on water temperature can cause areas on the windward side of a river or estuary to turnover and trap fish in tidal creeks and bays causing rapid drops in water temperatures and inducing a cold stun. An example of this phenomenon occurred during the winter of 2014-2015 in the Neuse River. Strong northerly winds coupled with below average air and water temperatures acted to “push” cold surface waters south into the creeks around Havelock. This cold water displaced the warmer water in the creeks and caused a water column turnover event trapping spotted seatrout and many other fish species in the headwaters of the creeks and causing a localized cold stun event. However, on the leeward side of the river, water temperatures did not change drastically and no cold stunned fish were observed or reported. Cold stun events can also occur over large areas of the state when light winds and clear night skies, along with prolonged below average air temperatures, act to cool the water down. This gradual decrease eventually drops bottom water temperatures to a point that can be lethal to spotted seatrout. These cold stun events can affect the entire coast causing catastrophic losses in all major riverine and estuarine habitats.


         The spotted seatrout fishery has only been closed twice in the history of the state due to population concerns from cold stun events, both occurring in the last decade in 2011 and 2014. However, cold stun events have occurred in North Carolina for centuries with written reports since colonial times (Lawson 1709). The life history of spotted seatrout is well suited for high and variable rates of annual mortality and often population level impacts from cold stun events are only evident for the year directly following a cold stun event (Figure 3). However, years with back to back cold stun events can prolong a rebound of the population. The original intent behind closing the spotted seatrout fishery was to protect mature fish from harvest after a cold stun to allow time for the fish to spawn and hopefully encourage the rebound of the population. Yet, rebounds in the population have been observed as early as the following year after cold stun events where no closure was instituted and commercial and recreational regulations were less strict than today. Additionally, it is difficult to determine if a closure significantly affects recruitment of fish the following year due to the current spotted seatrout assessment terminal year of 2012 (only one closure in the time series) and the difficulty of incorporating water temperature effects on natural mortality into the model. Not having an option to close the spotted seatrout fishery after a significant cold stun event goes against the recommendations of the MFC and comments from members of the public. Because this option would be against the recommendation of the MFC, it is not considered a viable option for the NCDMF adaptive management approach to cold stun closures and is presented here for informational purposes only.


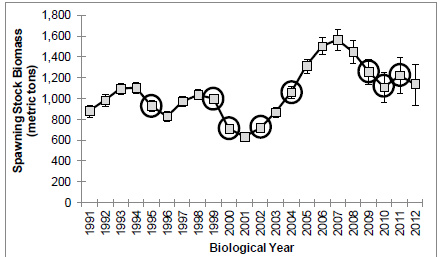
Figure 3. Predicted spawning stock biomass (SSB) for spotted seatrout annually from 1991-2012. Circles indicates years when cold stun events occurred (NCDMF 2015).


          Maintaining status quo with the current cold stun closure guidelines would be against the desires of the public. The inherent subjectivity of the current closure guidelines creates a loss of trust between the public and fisheries managers of the state and does not allow for objective, quantifiable metrics to inform the decision of a fishery closure. Also, current closure guidelines do not allow for regional closures, only statewide closures. This adversely affects fisherman in areas of the state where no cold stun has occurred and the impact to the local spotted seatrout population is minimal. However, the recommendation from the MFC for management of cold stuns gives the director the authority to close the fishery in the state, by region, if they so choose after a significant cold stun event. The director has never closed the fishery by region because cold stun closures have been issued under the current guidelines which require at least four counties to experience significant cold stuns. The areas of the state that are most frequently impacted by frequent, severe cold stuns are located in a few, large coastal counties. Closures under the four-county guidelines preclude regional closures because to meet the four-county threshold, so much of the state’s waters would have to be impacted and a statewide closure is usually the most prudent option. A modification of these guidelines to remove the four-county threshold will provide the director the opportunity to close the fishery by regions after significant cold stuns are reported. These regions can range in size from specific water bodies to statewide at the director’s discretion.


                                                                                                                              Given new information available about spotted seatrout temperature tolerances, mortality probabilities to sub optimal temperature exposure, and available continuous water temperature monitoring, management options can now incorporate quantitative thresholds to trigger closures. There is also the option to have these closures vary by spatial extent from statewide to individual river systems. Based on survival probabilities generated by Ellis et al. (2016; in review), average water temperature and exposure triggers of 5°C (41° F) at eight consecutive days and 3 °C (37.4 °F) during a consecutive 24-hour period should be considered. At these water temperature and time combinations, it is reasonable to assume that about half the fish exposed to these temperatures will succumb to mortality. When temperature triggers are met and cold stunned fish are observed and verified by NCDMF staff within a management unit, the fishery could be closed in that unit until the following spring. A statewide closure will protect all spotted seatrout in North Carolina ensuring that areas that do not have water temperature monitoring coverage but may still experience cold stun conditions are protected. However, this strategy will cause fishing opportunities to be lost in areas that may not be affected by cold stun conditions.


         A regional approach incorporating the 5 P°PC (41 °F) at eight consecutive days and 3 °C (37.4 °F) during a consecutive 24-hour period within a management unit could preserve fishing opportunities in unaffected areas and protect surviving fish in areas where cold stun events occurred. Tagging and genetics data suggest that spotted seatrout exhibit high site fidelity to their natal estuary with periods of greater movement during the spawning season (Ellis 2014; O’Donnel et al. 2014; Ward et al. 2007; Bradley and Chapman 2003). This, coupled with the limited movement of spotted seatrout during the winter months (Ellis 2014), support that the effects of a cold stun may vary regionally. By splitting the state into cold stun management zones, largely based on major riverine and estuarine systems, managers will have the ability to close areas where cold stun events occur while preserving fishing opportunities in others. However, fisherman from a closed area may move to an open area shifting and concentrating the effort and fishing mortality from one area to another.


         Cold stun closure regions should be broad enough spatially to encompass major estuarine and riverine systems where spotted seatrout overwinter and allow for adequate protection from fishing pressure after a closure is enacted until the following spring spawn has begun. The closure should extend through the peak of the spawning period of spotted seatrout and the closed region should be broad enough to protect fish from fishing pressure in the cold stun-affected area, as well as in areas where the species aggregates to spawn. In North Carolina, spotted seatrout spawn near seagrass beds, sandy banks and oyster reefs in and around creek and river mouths from April until October, with a peak spawn occurring around May and June (Burns 1996; Luczkovich et al. 1999). If possible, currently delineated management areas that meet the previously stated characteristics should be considered for cold stun closure regions. Continuity of management units among different management programs would aide Marine Patrol in enforcement of closures due to familiarity of boundaries and not burden fisherman with learning additional boundaries. The estuarine gill net management areas used by NCDMF to manage the estuarine gill net fishery for sea turtle interactions meet all of these considerations. The management units were delineated based on the similarity of fisheries occurring within them, similar water quality and habitat conditions, and the ability of NCDMF Marine Patrol to monitor fishing effort (NCDMF 2013; NCDMF 2014b). The spatial extent of these units are broad enough to cover the primary riverine systems of the state that are typically impacted by cold stuns and allow enough spatial coverage to protect fish spawning in these areas before the fishery is opened after a closure. However, for the estuarine gill net management units, the central portion of the state was divided into four regions based on historical sea turtle abundance in western Pamlico and Core sounds. For the purposes of cold stun closures, NCDMF staff decided to combine units B, C, D1, and D2 into one management area (Figure 4). The new cold stun management areas combine the major riverine and estuarine regions of the state into three discrete spotted seatrout cold stun management areas:

  • Area 1 includes the Albemarle Sound and all its tributaries including Crotoan, Roanoke, and Currituck sounds;
  • Area 2 encompasses all of Pamlico Sound, Tar-Pamlico and Neuse rivers and their tributaries, and all coastal waters in Carteret County from the Highway 58 bridge east; and
  • Area 3 includes all of the southern coast south of Highway 58.


         These broad management areas allow for affected fish, if they survive, to recover and spawn the following spring with the reasonable expectation that they will not be persecuted by a fishery within that area due to their limited movement during this time.

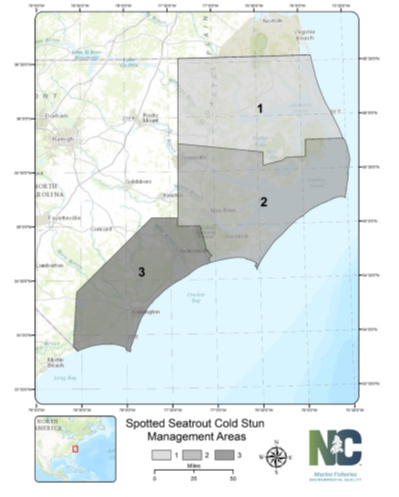
Figure 4. Map of the Spotted Seatrout Cold Stun Management Areas.


          Water temperature loggers require physical download to retrieve water temperature data which can delay the response time of NCDMF staff when investigating cold stun events. To speed up the time it takes to compile the water temperature information needed to make a decision on a fishery closure, NCDMF staff will monitor air temperature, weather forecast, and winter precipitation events during the winter months and download data from loggers when conditions are favorable for cold stuns. The cold stun of 2010-2011 occurred after a winter storm that covered much of eastern North Carolina in snow and ice and caused ice to accumulate on many creeks and shallow bays. The subsequent runoff of melted snow and ice entered the creeks and estuaries causing drops in water temperatures, which led to the severe cold stun event that occurred that winter. In contrast, the cold stun in February of 2014 occurred during a long period of below-normal air temperatures which gradually caused water temperatures to drop across the state. To ensure a timely response to future cold stuns, NCDMF staff will begin to download water temperature loggers and monitor coastal waters for affected fish when weather conditions when similar weather conditions are expected.


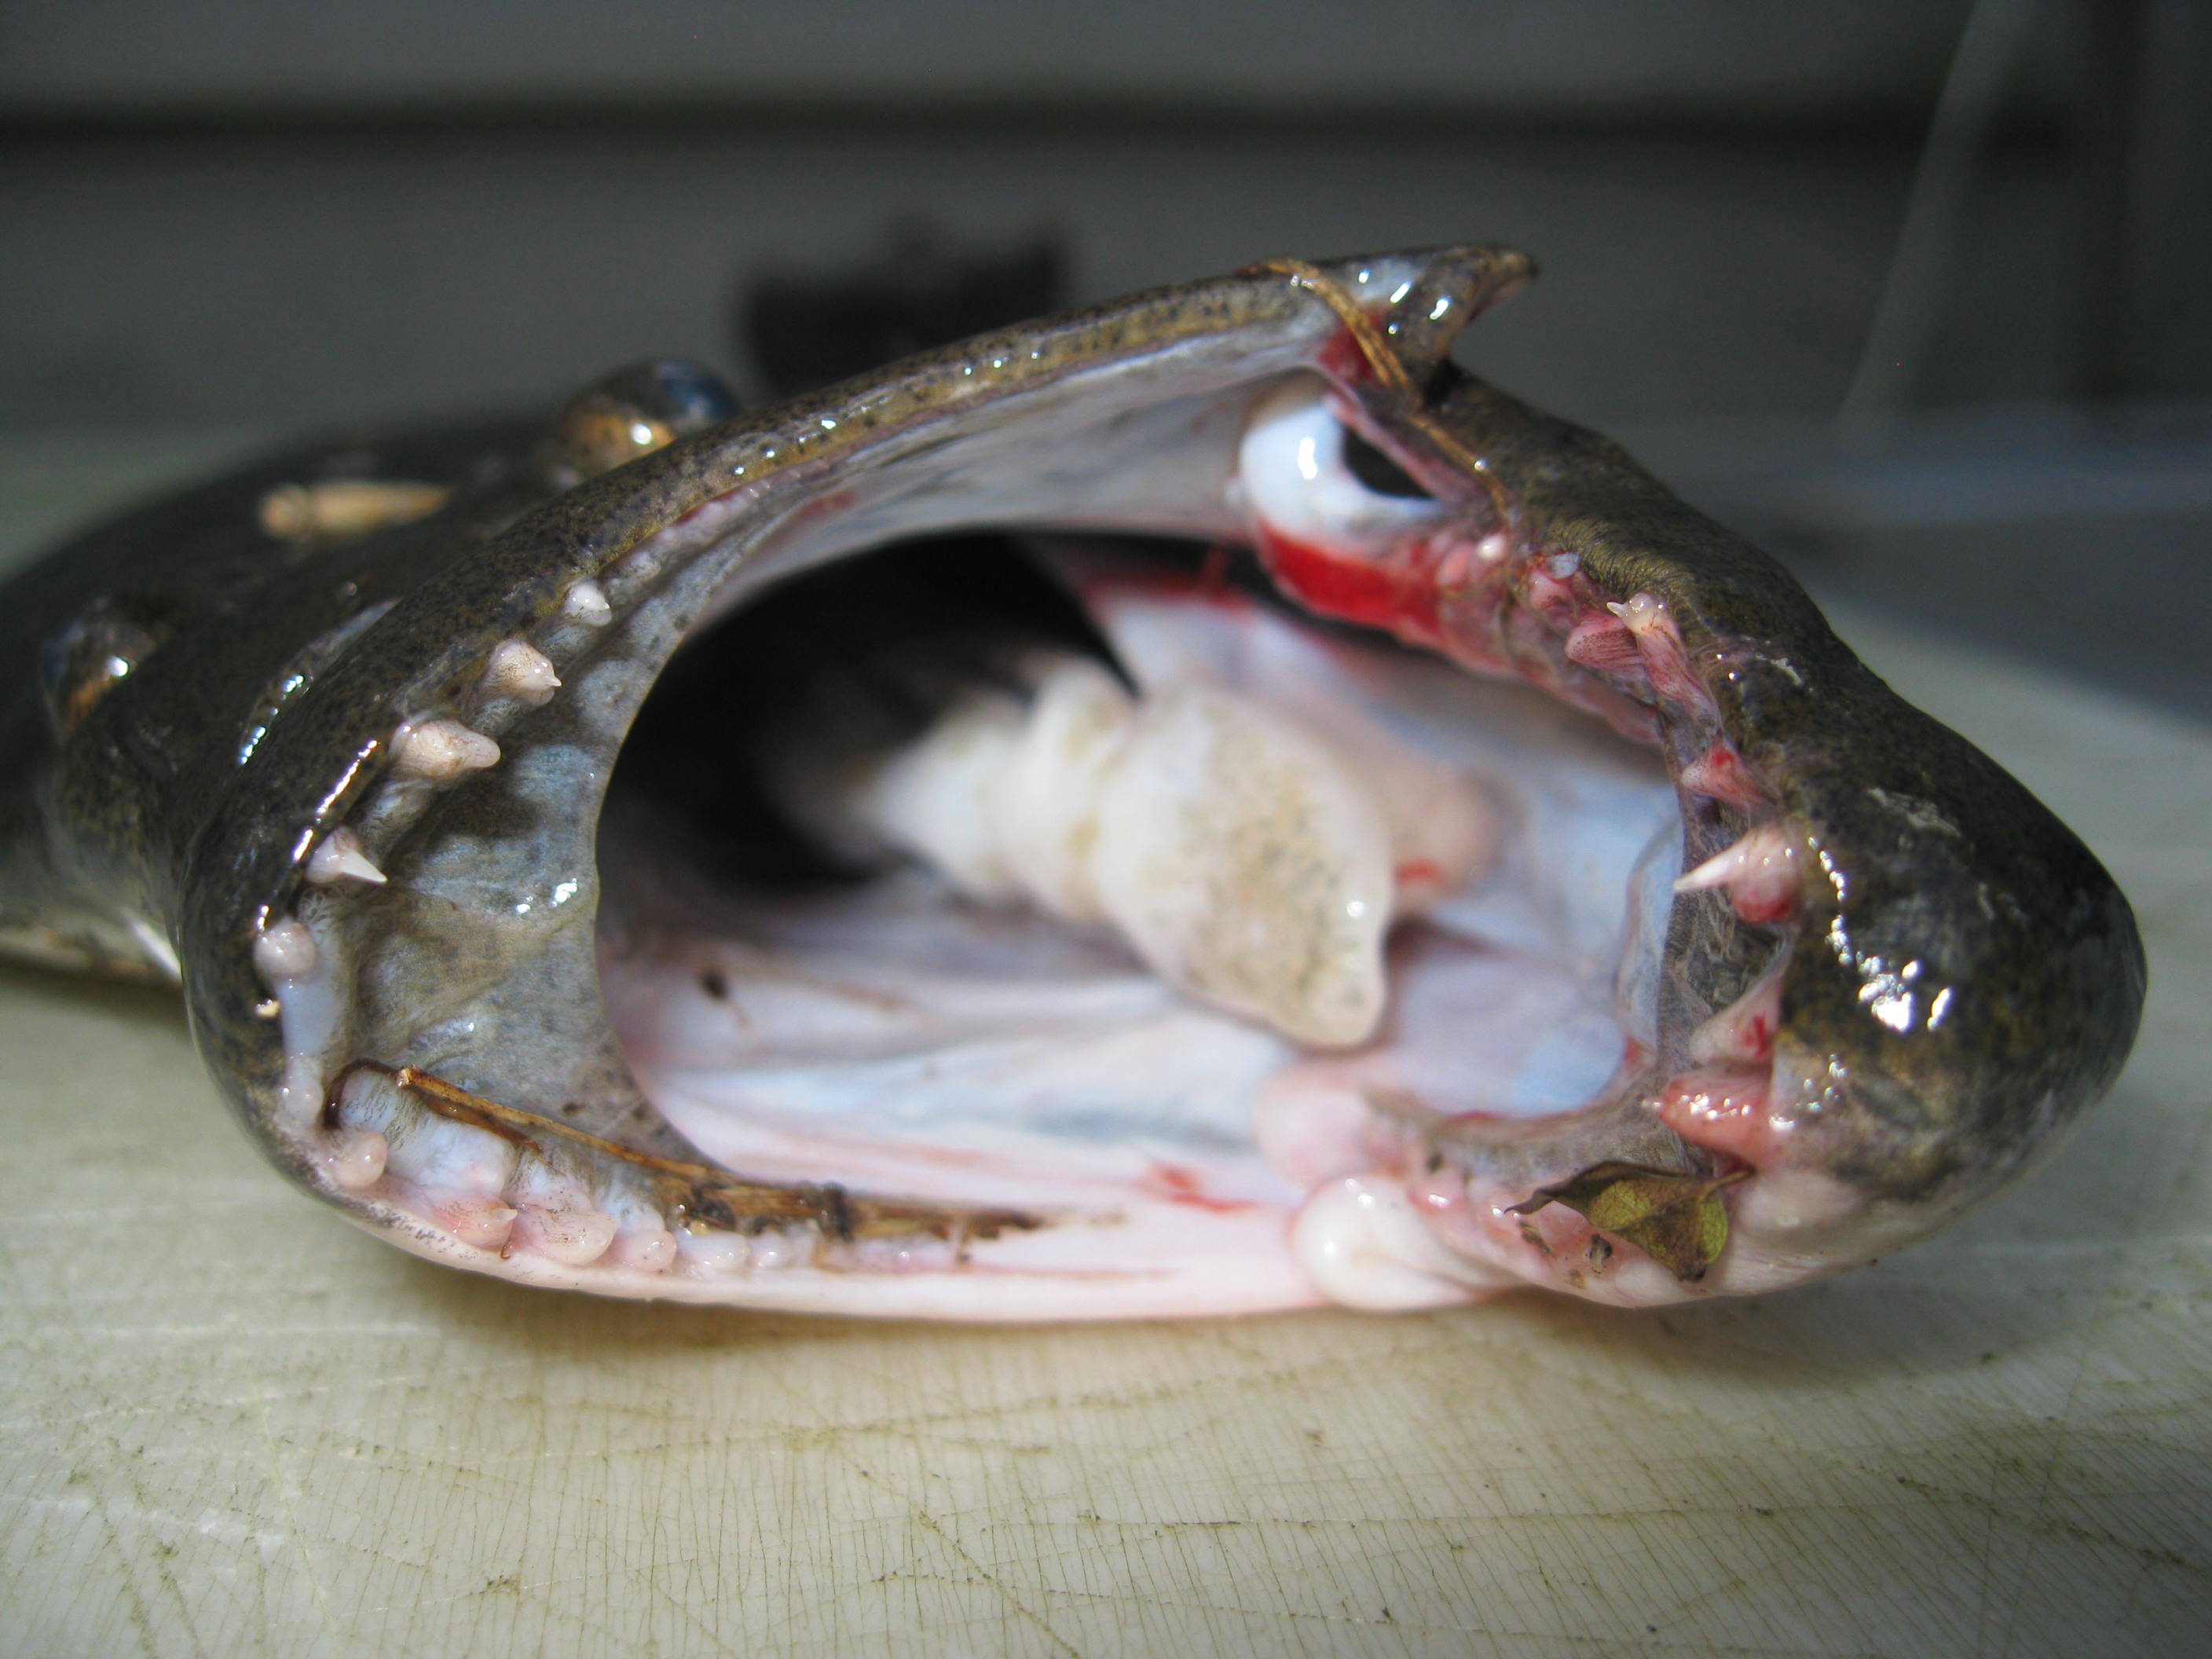
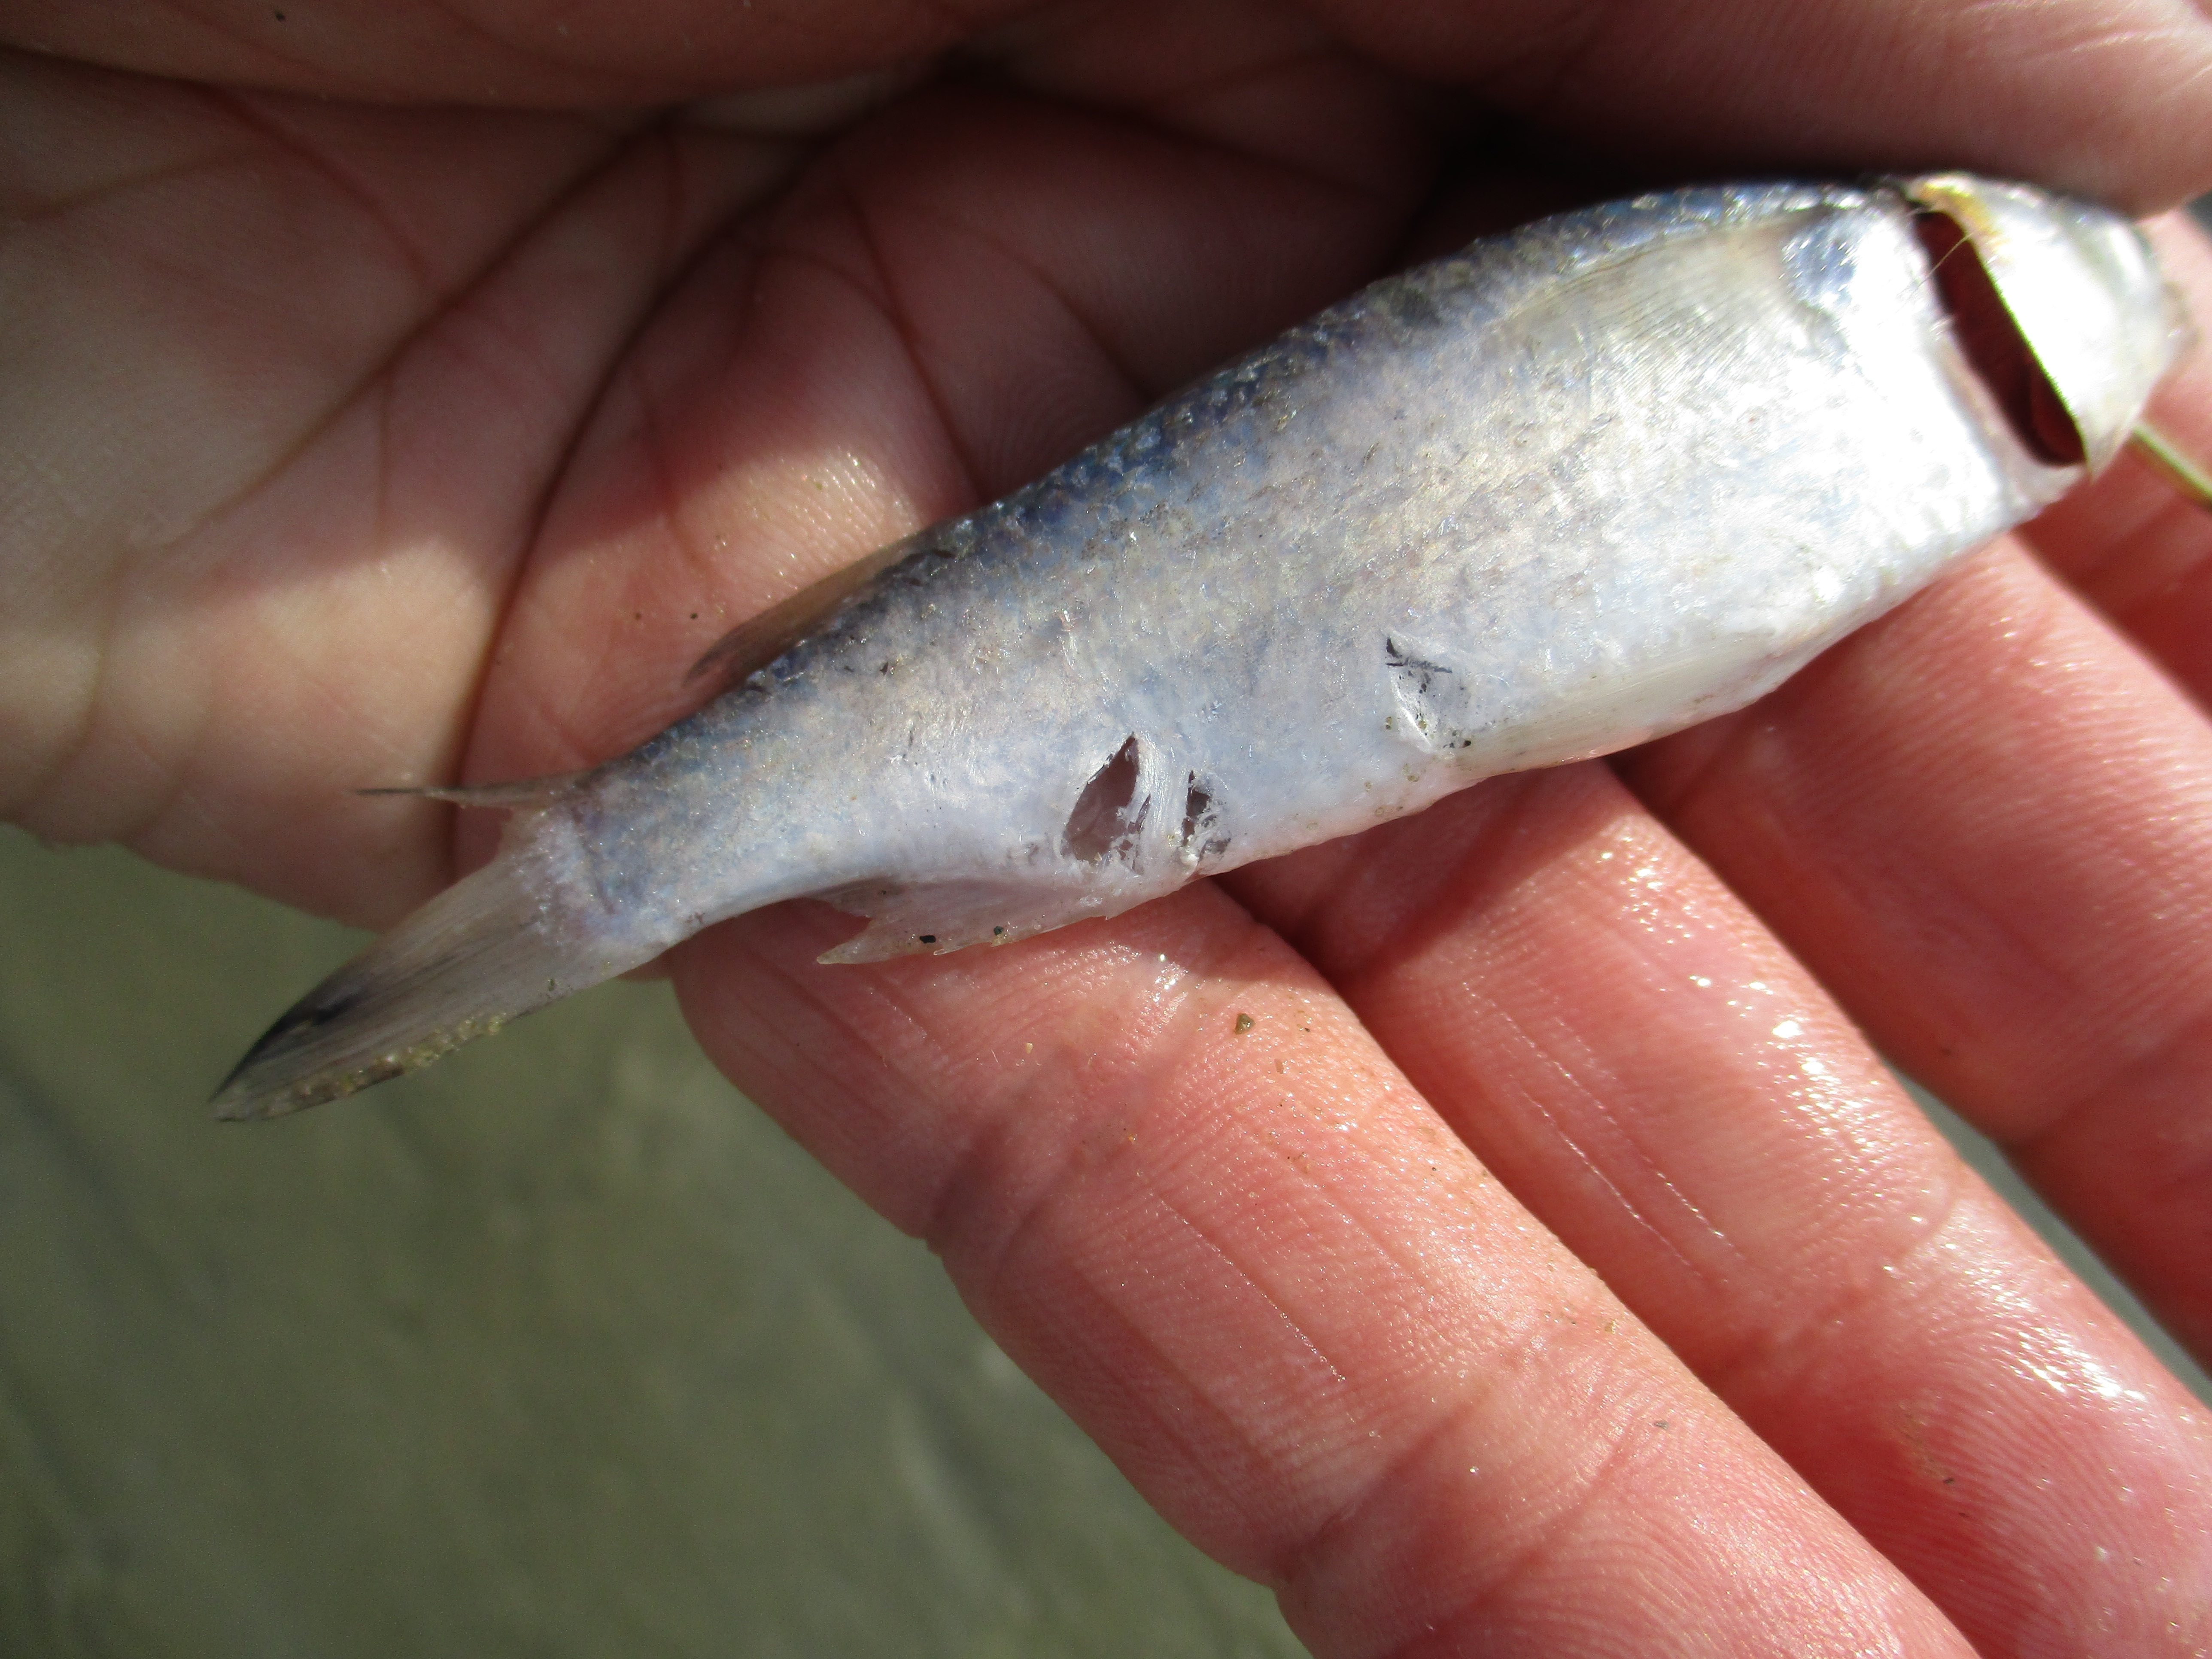
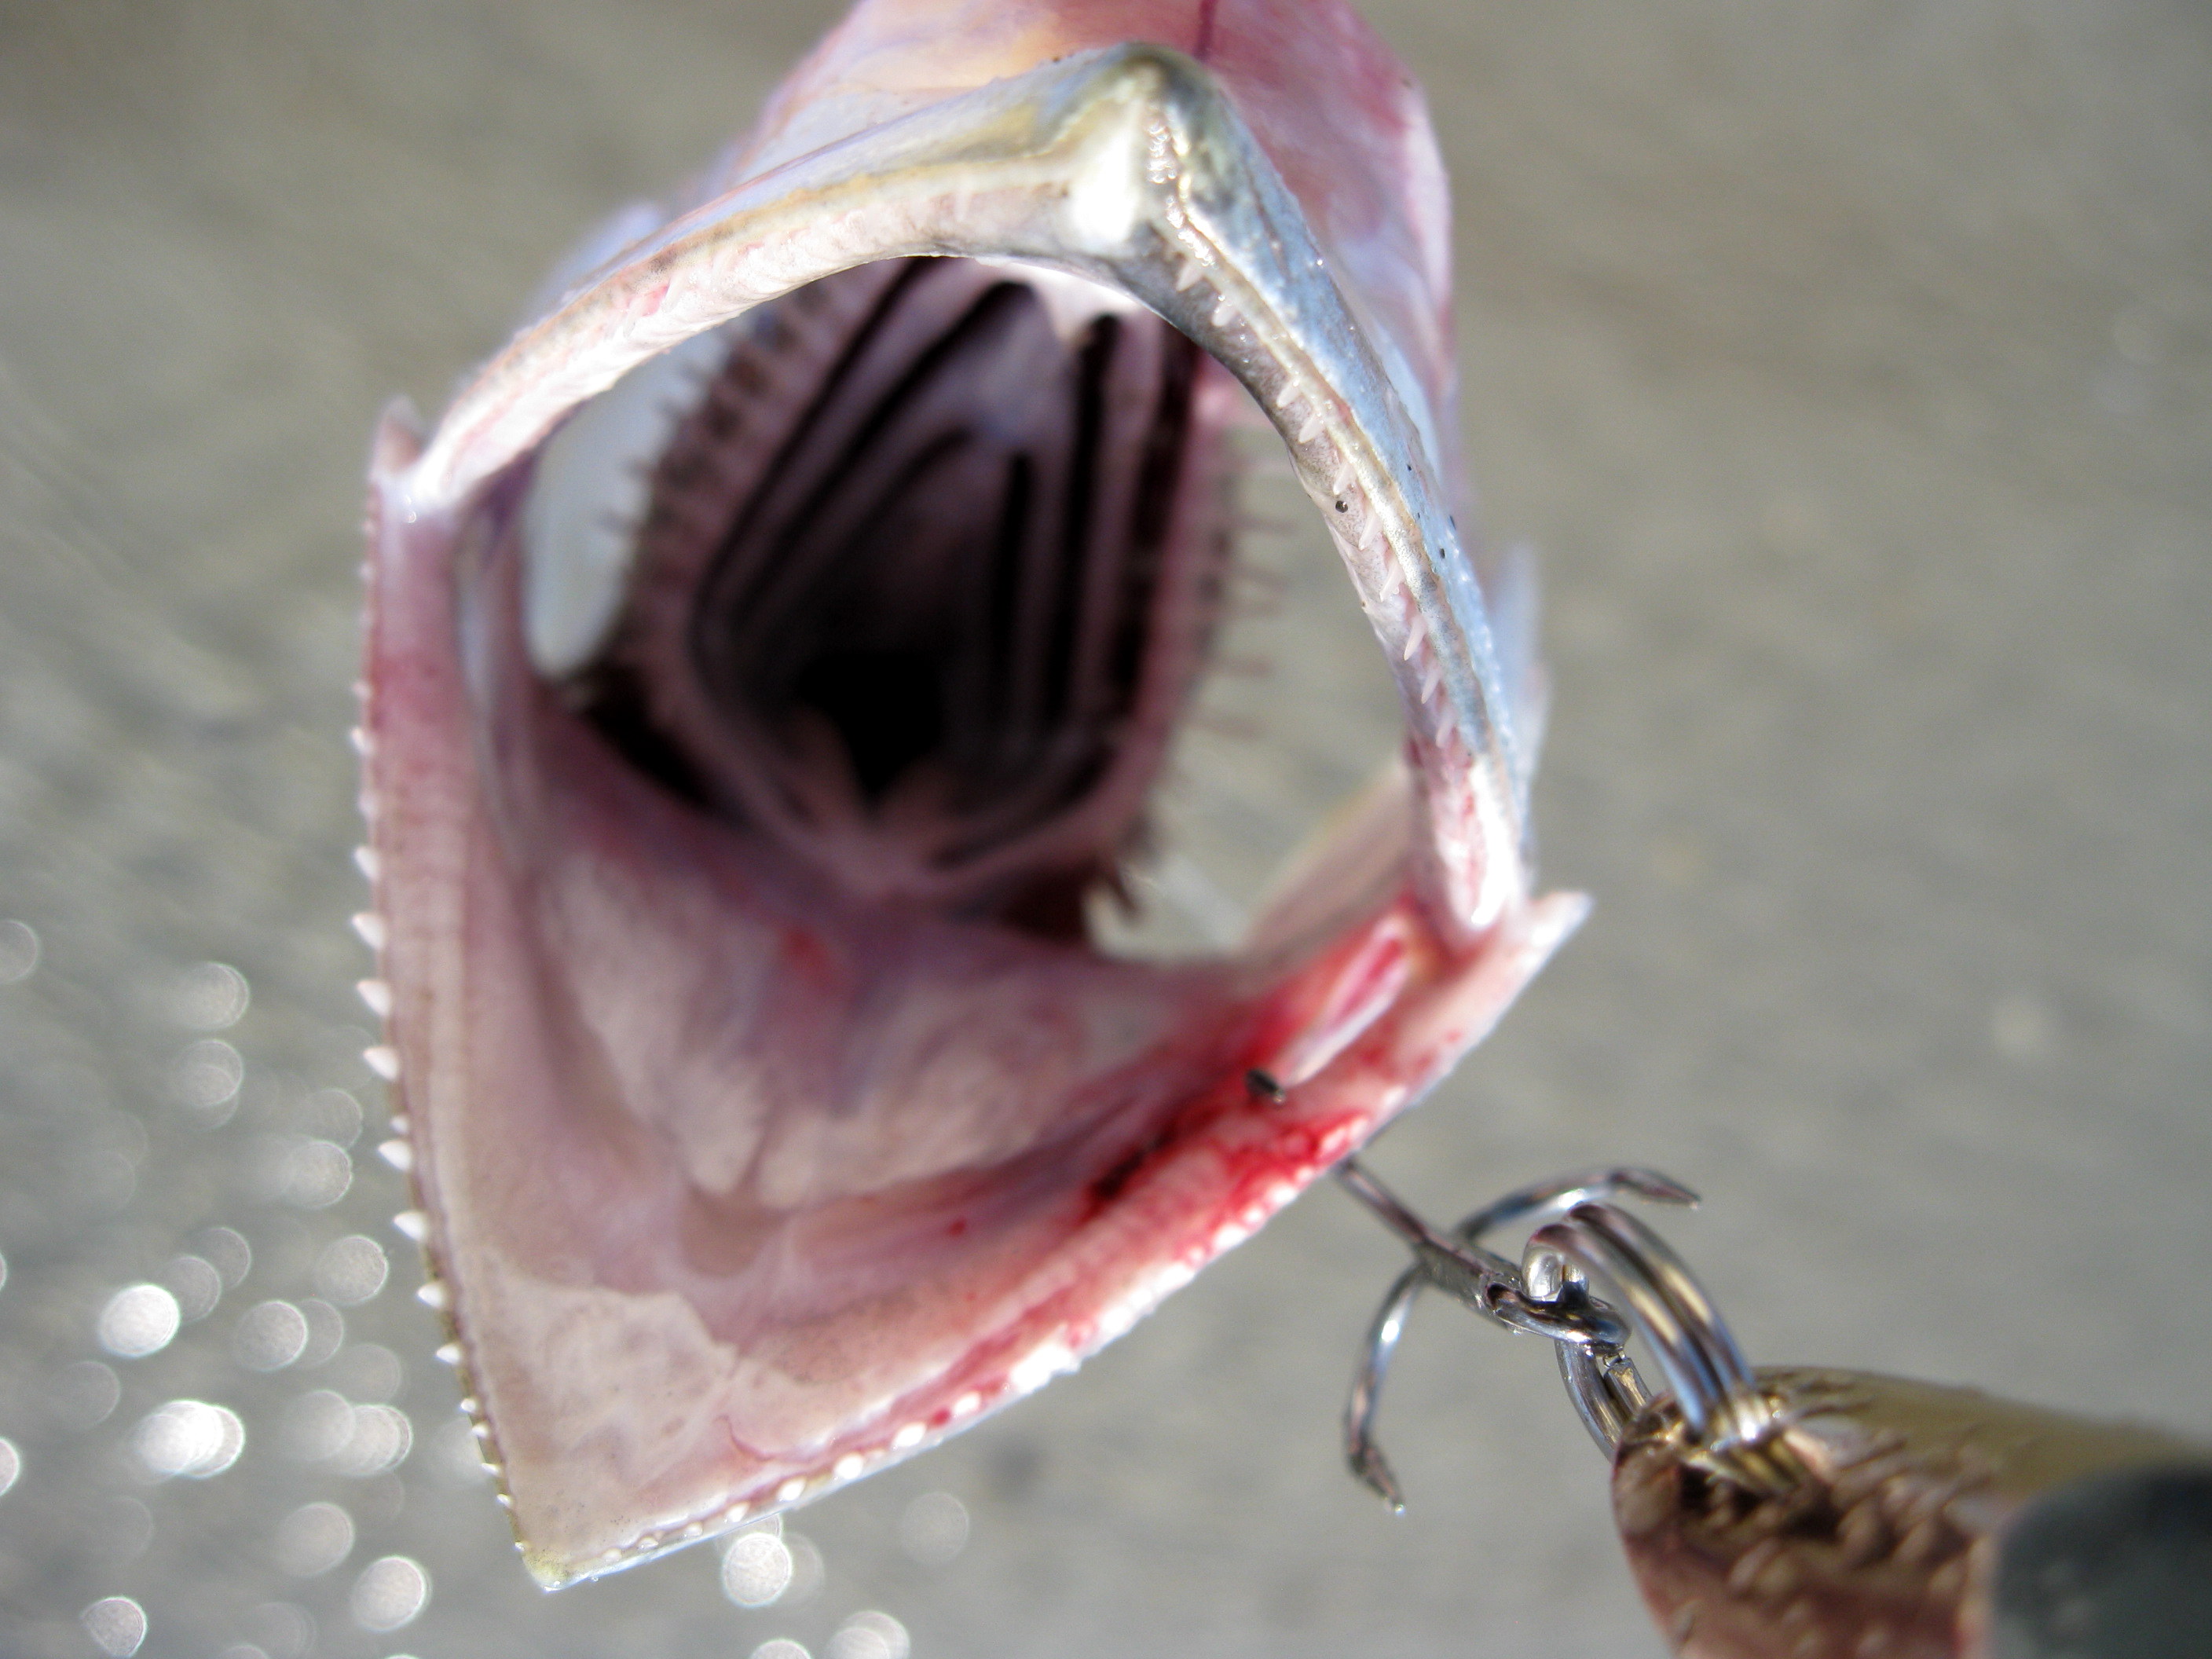
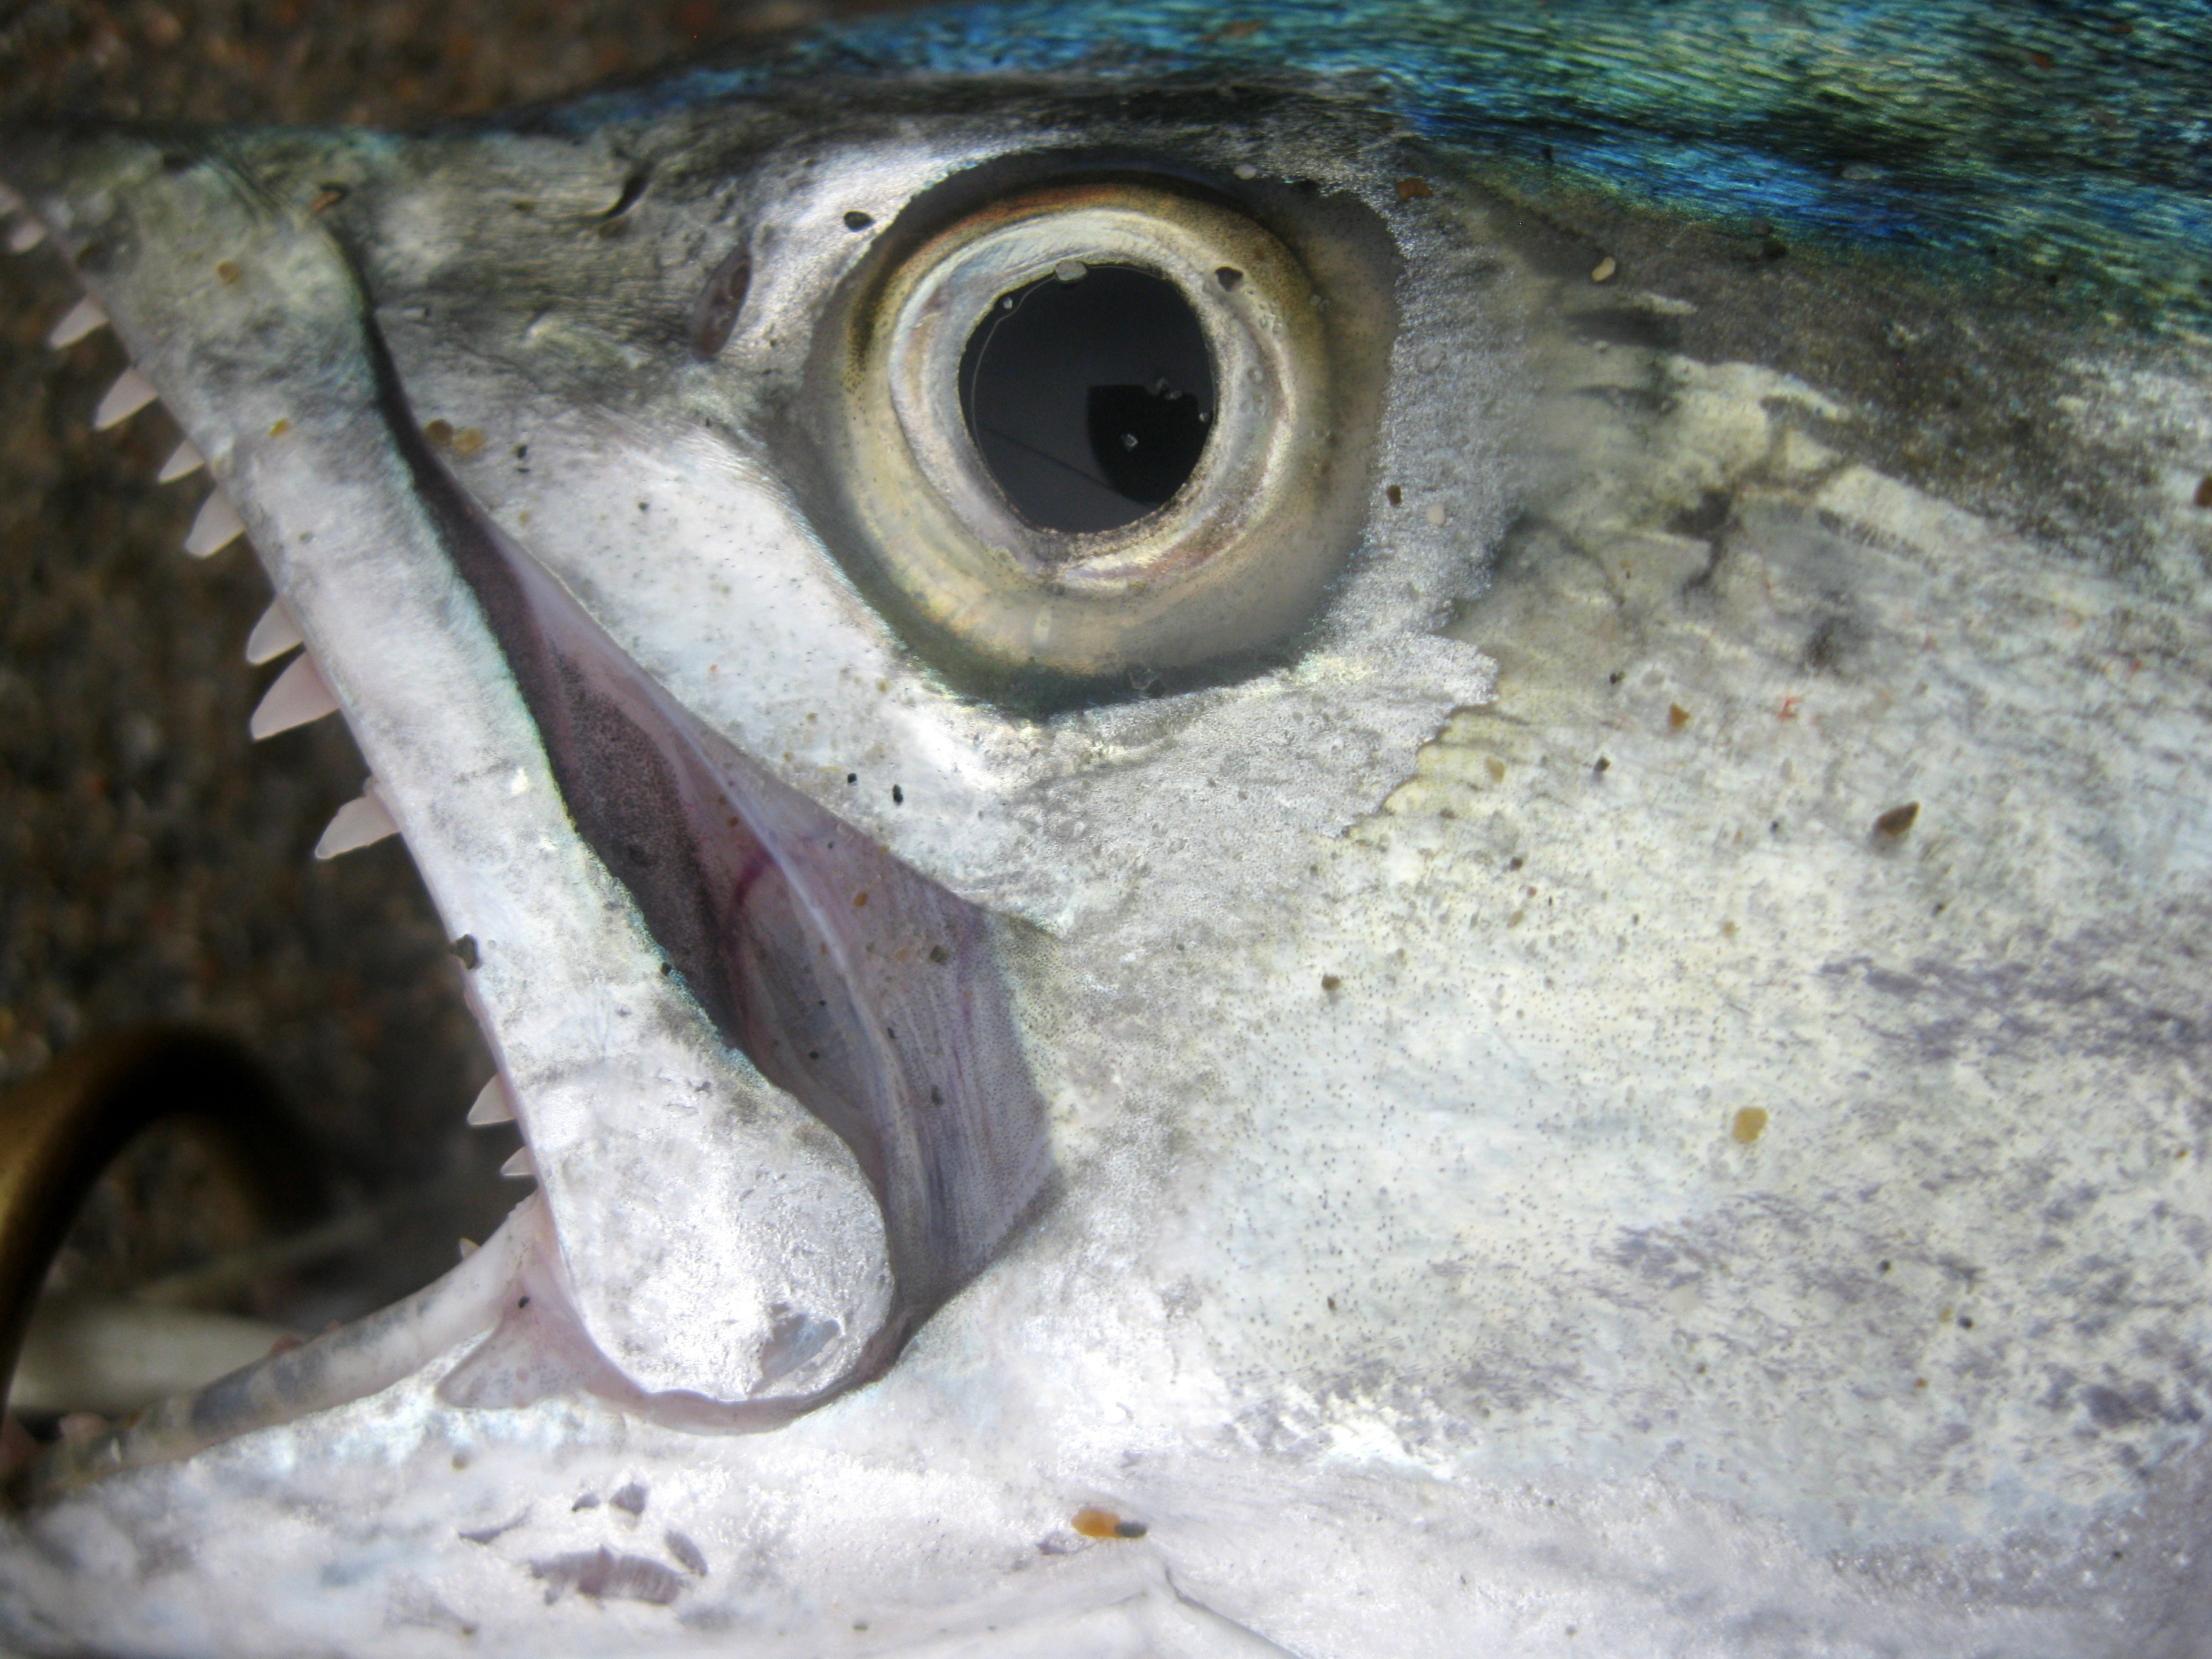
          The director has managed spotted seatrout fishery closures under the current closure guidelines with the interpretation that a significant cold stun event has to occur in at least four counties statewide before a closure is warranted. Ambiguity among the public and NCDMF staff over what constitutes a significant cold stun event in North Carolina has caused public concern. To remove some of the inherent subjectivity in deciding if a cold stun is significant, a quantifiable measure of the number of stunned or dead fish is needed. The North Carolina Division of Water Resources (NCDWR) monitors and reports on fish kill activity across the state and has developed protocols for classifying fish kills. NCDWR classifies a fish kill as at least 25 fish affected and verified by trained staff (NCDWR 2015). Cold stunned spotted seatrout in natural settings can vary in their observed condition from visably lethargic and slow to respond to external stimuli, to visable leisons and necrotic skin, to dead and rotting. Cold stuns ususally affect all spotted seatrout within an area and it can be assumed that if less than 25 cold stunned fish are observed and verified, then the number of spotted seatrout in that area is low and the impacts from a cold stun would be minimal.

V. Guidance


         Manage cold stun closures for spotted seatrout regionally (Figure 4) through an adaptive approach, taking into consideration:

  • The size and scope of a kill and temperature exposure;
  • The rate at which water temperature can change from cold-water runoff or prolonged below-average air temperatures; and/or
  • The evaluation of water temperatures and exposure triggers of 5°C [41°F] at eight consecutive days and 3°C [37.4 °F] during a consecutive 24-hour period.

VI. LITERATURE CITED


Anweiler, K. V., S. A. Arnott, and M. R. Denson. 2014. Low-temperature tolerance of juvenile spotted seatrout in South Carolina. Transactions of the American Fisheries Society. 143:999-1010

Bradley, A. W and R. W. Chapman. 2003 “Population structure of spotted seatrout, Cynscion nebulosus, along the atlantic coast of the U. S.” Biology of spotted seatrout, Edited by S. A. Bortone. CRC PressBoca Raton, Florida. 31-40 p.

Burns, B. 1996. Life history aspects of marine recreational fishes in North Carolina. North Carolina Department of Environment and Natural Resources, Division of Marine Fisheries, Project F-43, Morehead City, North Carolina. 25 p.

Ellis, T. A. 2014. Mortality and movement of spotted seatrout at its Northern latitudinal limits. Dissertation North Carolina State University. 258 p.

Ellis, T. A., J. A. Buckel, J. E. Hightower, and S. J. Poland. 2016. In review. Relating cold tolerance to winterkill for spotted seatrout at it northern latitudinal limits. Journal of Experimental Marine Biology and Ecology.

Lawson, J. 1709. A new voyage to Carolina. London, England. 270 p.

Luczkovich, J. J. R. C. Pullinger, S. E. Johnson and M. W. Sprague. 1999. Identifying the critical spawning habitats of sciaenids using passive acoustics. Transactions of the American Fisheries Society, 137: 576–605.

North Carolina Division of Marine Fisheries. 2009. Stock Status of Spotted Seatrout, Cynoscion nebulosus, in North Carolina, 1991-2008. NCDMF, Morehead City, North Carolina. 90 p.

North Carolina Division of Marine Fisheries. 2012. North Carolina Spotted Seatrout Fishery Management Plan. NCDMF, Morehead City, North Carolina. 344 p.

North Carolina Division of Marine Fisheries. 2013. Application for an individual incidental take permit under the endangered species act of 1973. NCDMF, Morehead City, North Carolina 154 p.

North Carolina Division of Marine Fisheries. 2014. Application for an individual incidental take permit under the endangered species act of 1973. NCDMF, Morehead City, North Carolina 165 p.

North Carolina Division of Marine Fisheries. 2015. Stock Assessment of Spotted Seatrout, Cynoscion nebulosus, in Virginia and North Carolina Waters. NCDMF, Morehead City, North Carolina. 142 p.

North Carolina Division of Water Resources. 2015. North Carolina Division of Water Resources Annual Report of Fish Kill Events 2015. NCDWR, Raleigh, North Carolina. 16 p.

O’Donnel, T. P., M. R. Denson, and T. L. Darden. 2014. Genetic population structure of spotted seatrout Cynoscion nebulosus along the Southeastern U.S.A. Journal of Fish Biology. 85:374-393.

Ward, R., K. Bowers, R. Hensley, B. Mobley, and E. Belouski. 2007. Genetic variability in spotted seatrout (Cynoscion nebulosus), determined with microsatellite DNA markers. Fisheries Bulletin. 105:197-206.

This document was prepared by Steve Poland (Steve.Poland@ncdenr.gov) with input from the NCDMF Spotted Seatrout Plan Development Team and Management Review Team.


Posted by & filed under Articles, Fishing.

Surf at Bogue Pier ranged from high of 62-degrees to a low of 50-degrees with an average of 54.7-degrees (blue diamonds). Bogue Sound had a high of 64-degrees but a low of 42-degrees with an average of 50.7-degrees (red squares).  Temperatures in December were near normal. Slope was negative showing a decrease was about 0.21-degrees/day.  For the year, the average temperature for 2016 was 66.4 around normal but cooler than 2016. Other plots are actual data for 2004 through 2016 with the average plot (black curve) for data from 1996-2016, and plot of each year’s data from 1995.


fullscreen-capture-162017-115414-am-bmp

.

Actual data for 2004 through 2016 with the average plot (black curve). See Below.

fullscreen-capture-162017-115441-am-bmp


.

Plot of each year’s data from 1995-2016 (See Below)

fullscreen-capture-162017-115458-am-bmp


Posted by & filed under Articles, Fishing.

Surf at Bogue Pier ranged from high of 69-degrees to a low of 57-degrees with an average of 61.7-degrees (blue diamonds) about 10 degrees colder than last month. Bogue Sound had a high of 66-degrees but a low of 47-degrees with an average of 57.5-degrees (red squares), nearly 12 degrees colder than October.  Temperatures in November were near or slightly above normal. Slope was negative showing a decrease was about 0.32-degrees/day. Since mid-November, my surf temperatures have been taken along the beach just west of the pier in the Western access in Emerald Isle since the pier is closed due to major renovations. I have a bottle I can cast from the beach to collect the water.


fullscreen-capture-1252016-11225-pm-bmp

Posted by & filed under Articles, Fishing.

Surf at Bogue Pier ranged from high of 78-degrees to a low of 66-degrees with an average of 71.8-degrees (blue diamonds). Bogue Sound also had a high of 78-degrees but a low of 61-degrees with an average of 69.3-degrees (red squares).  Temperatures in October were near or slightly above normal. Slope was negative showing a decrease was about 0.34-degrees/day.


fullscreen-capture-1122016-14215-pm-bmp

Posted by & filed under Articles.

The lore and names behind the Rocks of the Crystal Coast, By Dr. Bogus and Capt. Lee Manning

There’s an old adage good fishing and structure go hand-in-hand. Food and shelter beget little fish, which beget bigger fish and so on to the biggest of fish. This goes for freshwater, saltwater, inshore, offshore and any shore you want to mention. North Carolina, appropriately known as the Graveyard of the Atlantic, is awash in structure with wrecks, reefs and rocks that dot our coast from north to south. The central Crystal Coast region of the Old North State is particularly notable due to the proximity of natural near shore rocks and reefs readily accessible to the weekend small boater. Near shore rocks like Lost Rock, Christmas Rock and Honeymoon Rock are local fish havens and popular and productive fishing locations, but did you ever wonder how they got their names? I certainly have!

To demystify this lore of the sea, I consulted Capt. Lee Manning; a former schoolteacher turned charter captain over 30 (now more like over 40) years ago. Capt. Manning currently operates the Nancy Lee Fishing Center in Swansboro and his experience not only holds the key to finding fish, but a long resident of the area, he has absorbed much of the local lore of the rocks and reefs as well.

Highlighting the accessibility of these fishing structures, Manning said, “Well, we’re fortunate, out of Bogue Inlet that we have a lot of rocks that are close to our inlet, probably more than most areas around here. We have probably six or seven that are within four, five, or six-miles of the inlet and most of them are rocky bottom and most of them have coral on them.”

When asked how close is close, Manning said “The closest rocks are probably Station Rock and Keypost within just two or three-miles from the Bogue Inlet. Super fishing, all kinds of fish like flounder, sea bass and a little bit of everything and of course in the spring and fall we have the king mackerel that come in along with other fish along the shoreline too.”

As fisherman, we’re always interested in what the bottom really looks like. In response, Manning said that “I’m not a diver, so I have my own imagination. I imagine what it looks like. Over the years, we catch pieces and it looks like rock. Some of it looks like shell rock, like it’s cemented together, when you pull it up, some is coral. Most all the ledges drop of five, six maybe seven-feet, at different points of the rock areas.”

So how did some of these rocks get their names? “First of all, Station Rock,” said Manning, “got its name years ago before we had the Lorans and GPSs and all the sophisticated equipment. You would use the Swansboro Coast Guard Station; it had a tower on it, a lookout tower. You lined the tower up with the Swansboro water tower and you go straight out. With your “paper machine” which we had then, you would mark the bottom, plus you could use the line up with Bogue Pier and one of the houses on the beach (there was not so many houses on the beach back at that time), and you could find Station Rock real easy. So it was named because of the station lookout on the Coast Guard Station.” Sure makes sense.

Speaking of making sense, how about 45-Minute Rock?  “Forty five-Minute Rock”, said Manning, “ of course back years ago most of the boats that went out, with the speeds they ran, it took about 45-minutes to get there. They timed it and they would check the bottom with either wax or pitch from pine tree resin on a drop line and check the bottom and find it where it was shelly or bring up little pieces of rock on it, and of course they would start fishing in that area.”

Not all the names of the rocks are agreed upon by all. For example, “the Honey Hole and Sponge Rock,” said Manning, “are really the same rock.” “Over the years, it’s kind of changed. We always called it the Honey Hole. It’s the first section you get to when you go past 45-Minute Rock in a southerly direction. The divers started diving on it and found lots of sponge around the area and they started calling it Sponge Rock, and now the Honey Hole seems like it’s moved a little to the next set of rocks, and people started calling that the Honey Hole. But, Honey Hole and Sponge Rock were the same rock in the beginning,” said Manning.

“Farther out is the South East Bottoms, but it is the same thing,” said Manning, “it’s generally the first set of rocks to the southeast after you leave 45-Minute Rock.” When asked about the area, Manning responded, “Southeast Bottoms is a big area, a real big area with a lot of rocks, just to the east, southeast of Charlie (“C”) Buoy.” When asked about the fishing the bottoms, Manning smiled and said, “In the summertime you have all kinds of fish there. You have sailfish, dolphin (mahi-mahi), there’s even been wahoo caught out there. There is some of everything caught out in that area. It’s really a super good area and a super good king mackerel area too.” And it’s less than ten-miles out of Bogue Inlet, just set a southeasterly course.

With the rock locations well known, most people make the mistake to fish right on top of them, but as Manning was quick to point out, “Most of the rocks, if you go around them and fish them a lot, you’ll find little outcroppings all around the area in any direction and over the years, as I fish more, I fish were the ledges play out and the bottoms play out and the fish seem to congregate there more than the main part of the rocks. Maybe it’s because everybody fishes on the main part of the rock and the fish have moved out around the edges.”

Since it’s presumed that the rock locations were well know, how did Lost Rock get its name? “Well,” said Manning, “Lost Rock, is a rock that the biggest part of the rock runs perpendicular to the shore and was always very, very hard to find. You could be real close to it but ride right by it, and it was located in such a place that it was hard to look at the shoreline and find line-ups. We would fish on it once or twice a year when we would happen to stumble across it. And of course, once we got the Lorans and GPSs we finally got numbers on it, it wasn’t lost anymore. But we called it Lost Rock, because we couldn’t ever find it.”

One of the best close-in fishing rocks is Keypost, which is found directly out from the end of Bogue Inlet Fishing Pier in Emerald Isle. Describing the Keypost manning said, “It is really a long rock. They call it Inner Keypost, Outer Keypost, there’s a middle part of it too, and it’s a real long rock that probably runs a mile, mile and a half, maybe two miles offshore. We caught flounder on all the Keypost Rocks this past summer, sometimes as many as 30 flounder a day fishing there, and the biggest one was over 7-pounds.”

But to unearth the name, you’ll have to go all the way back to World War II (WWII) when our coast was threatened by German U-boats. “Back there in WWII,” said Manning, “the people that were watching the shoreline walked down the beach, and there was a post down there with a key in it and a lock box and they had to go down when they walked the beach, they had to unlock it and had to initial the card that was in there and lock it back up to verify that they had made the trip down the beach. That was the “keypost” and out from there was the Keypost Rock!”

Some of the rocks have a bit of a personal touch in the name. “Right down the beach, past the Keypost is Tom Smith’s Rock,” said Manning. “Tom Smith was a shrimper years ago and he stayed tangled up in the rocks all the time with his net, so they called it Tom Smith’s Rock.” Definitely a local joke.

“There are some other rocks, said Manning, “like East Rock, which is just the direction we have to go out of Bogue Inlet to get to it.”

With Valentine’s Day recently passed, with all the romance, there is one name that comes up, Honeymoon Rock. Yes it’s what you might guess,” said Manning, “Honeymoon Rock came from…well, one of our captains, many years ago got married and that’s where he spent his honeymoon. He took the boat out with his new wife, anchored up…and that was Honeymoon Rock.” One wonders if there is a Divorce Rock too!

As we can see, some of the rocks are named by direction, location, landmarks and even tongue and cheek after “notable” fisherman, others from use. That includes Christmas Rock, but it may not be what you might think. “Christmas Rock,” said Manning, “you have to go back years ago. The boys out of Sneads Ferry, when it would start getting to Christmastime, they needed money for Christmas, they went out with their fish pots and catch some sea bass and sell them. There caught lots of sea bass out there, and they always called it Christmas Rock.” And now it’s on the charts and we all know it as Christmas Rock.

Another set of rocks just out of Bear Inlet is the Bear Inlet Rocks. No mystery what they were named for, but there are actually two sets of rocks. “There inshore Bear Inlet Rock, and there’s the offshore Bear Inlet Rock,” Manning pointed out, “and both of those rock areas are very, very good. Inshore Bear Inlet has a lot more rough bottom and there is one place with pretty steep ledges. The offshore Bear Inlet Rock has a really good ledge that runs right through the middle of it and is easy to find. Both areas are really good fishing.”

There are not only rocks out there that hold and sustain our local fishery, but the marked and maintained artificial reefs and the numerous wrecks too. However, Manning mainly sticks to fishing the rocks. Why? Manning was emphatic and noted that, “I very seldom fish the wrecks unless I’m trolling because so many people know where the wrecks are and they troll on them. Usually the wrecks hold barracuda and so you catch lots of half-a-fish! “Mainly the divers like to go there and recreational folks go there,” he said. “There are so other many placers that I can go, but if I’m going by there I’ll troll across it,” said Manning.

Now that we have demystified some of the history and lore of some of your favorite nearshore fishing rocks of the Crystal Coast, and with spring fast approaching, can a great season of fishing be far behind? After the trials and tribulations of last season, I certainly hope that 2004 is a good one. Then there is the BIG ROCK! You’ve heard of it, it’s a ROCK and it’s very BIG, enough said.

img_1645

GPS of Rocks:

45-Minute Rock: N 34 33.06      W 77 03.31

Bear Inlet Rock: N 34 35.14      W 77 08.71

Christmas Rock:  N 34 23.54     W 77 09.52

East Rock (Bogue): N 34 35.33      W 76 56.75

Honey Hole/Sponge Rock: N 34 26.30      W 77 01.30

Honeymoon Rock: N 34 27.65      W 77 08.78

Keypost Rock: KP1: N 34 38.18 W77 01.90, KP2:  N 34 37.75   W 77 01.76

Lost Rock: N 34 32.00      W 77 06.06

Southeast Bottoms: SEB1: N 34 29.42   W 77 01.62, SEB2: N 34 30.10   W76 59.74, SEB3: N 34 29.18   W76 58.34

Station Rock: N 34 35.27 W 77 04.11


Posted by & filed under Articles.

Surf at Bogue Pier ranged from Low of 78-degrees to a high of 82-degrees with an average of 79.6-degrees (blue diamonds). Bogue Sound had a low of 74-degrees and a high of 82-degrees with an average of 79.0-degrees (red squares).  Flat-flat-flat plot of the temps in surf and sound showed little variation and a flat horizontal slope of around 0 (zero).


fullscreen-capture-1022016-115949-am-bmp

Posted by & filed under Articles, Fishing.

Emerald Isle Water Temperatures for August 2016

Surf at Bogue Pier ranged from Low of 79-degrees to a high of 85-degrees with an average of 82.2-degrees (blue diamonds). Bogue Sound had a low of 81-degrees and a high of 88-degrees with an average of 83.9-degrees (red squares). August mostly stayed in the low 80s in the surf at the beginning and end with a spike to the mid 80s mid month. First mullet blow was on 8/30/16, right on time. Anchovies made their appearance on 8/23/16.


Fullscreen capture 8312016 13814 PM.bmp