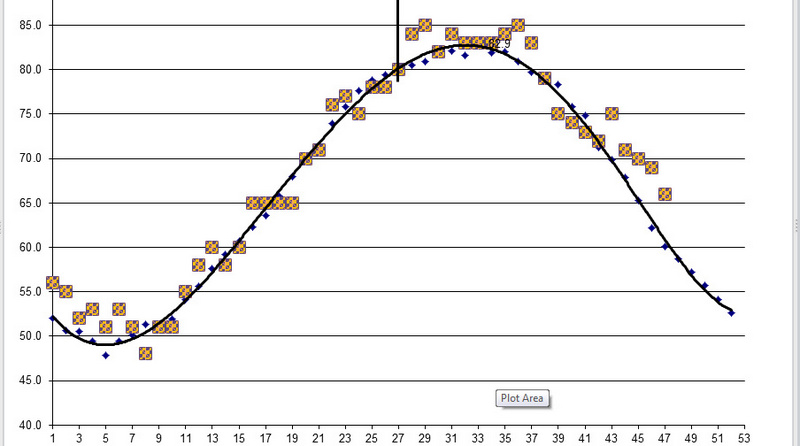
Black curve is the average data from 1996 to 2020. Colorful squares are 2020 data to the present. X-axis is week of the year, Y-axis Water temperature at Bogue Pier. Lone vertical bar near the top of the graph is 4th of July. Pretty warm temps for the 2020 year so far.
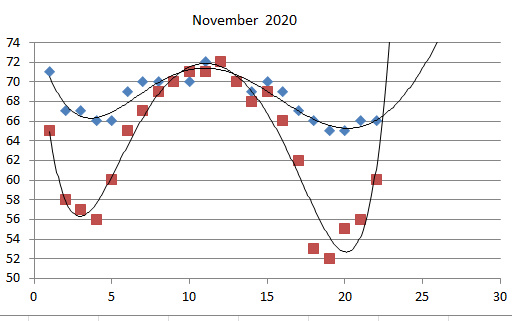
November surf (blue diamonds) and sound (red squares) water temps fr Emerald Isle.